Balance view
| Balance view / balancing group |

The balance view enables a graphical representation of the recorded quantities for a selected measured variable and a defined time range.
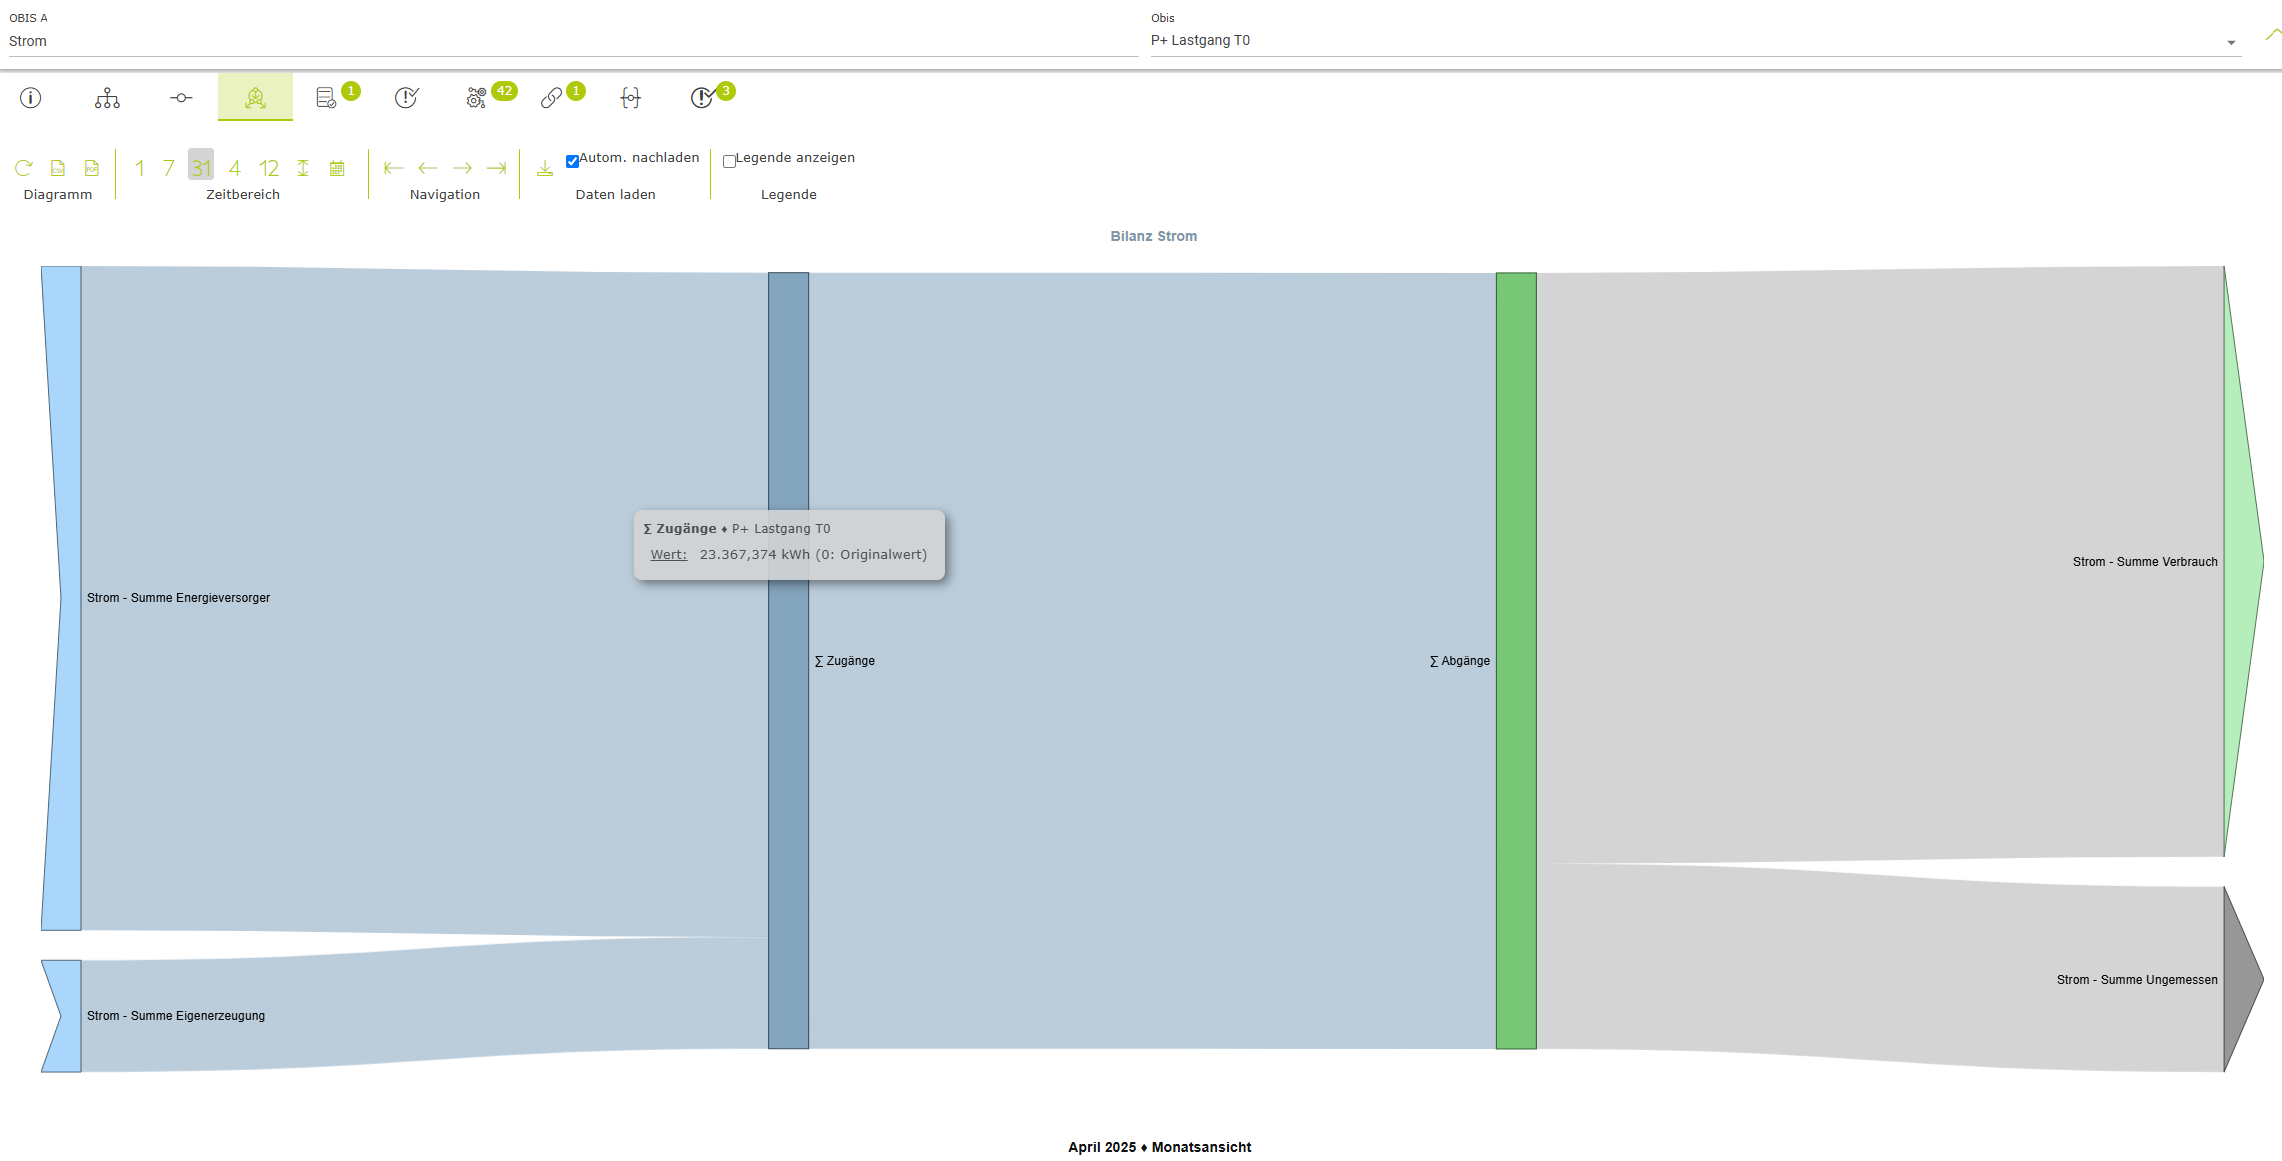
Toolbar
Chart | ||
| Refresh | Reloads the data from the database and updates the chart. Please note: any unsaved changes will be overwritten by the most recent version stored in the database. |
| CSV download | Generates a CSV data file and enables the browser’s download/save function. |
| Properties | Opens a dialog box containing the chart properties. Here, you can, among other things, show or hide the columns in the legend. |
Display (not available for all chart types) | ||
| Time chart view | Values for the current time range are displayed in a level (x)–time (y) view. Depending on the measured variable, the level can be displayed as a line, a bar or point. |
| Value table view | The values for the current time range are displayed as a table. |
| Frequency distribution view | Values in the current time range are sorted by value rather than chronologically by time. |
Time range | ||
| Day view | The time range is scaled to one day. |
| Week view | The time range is scaled to one week. |
| Month view | The time range is scaled to one month. |
| Quarter view | The time range is scaled to a quarter. |
| Year view | The time range is scaled to one year. |
| Display entire time range | The entire time range available in the database is loaded and the view is scaled accordingly. |
| Custom time range | The display range can be customised by specifying a start and end date. |
Navigation | ||
| Go to the first record | The first available data is loaded and displayed within the currently selected time range. |
| Go to the previous range | Displays the previous range. |
| Go to the next range | Displays the next time range. |
| Go to the last record | The most recent available data are loaded and displayed within the currently selected time range. |
Show legend | ||
Allows you to show or hide the legend. | ||


