Filter analysis
| Filter analysis |

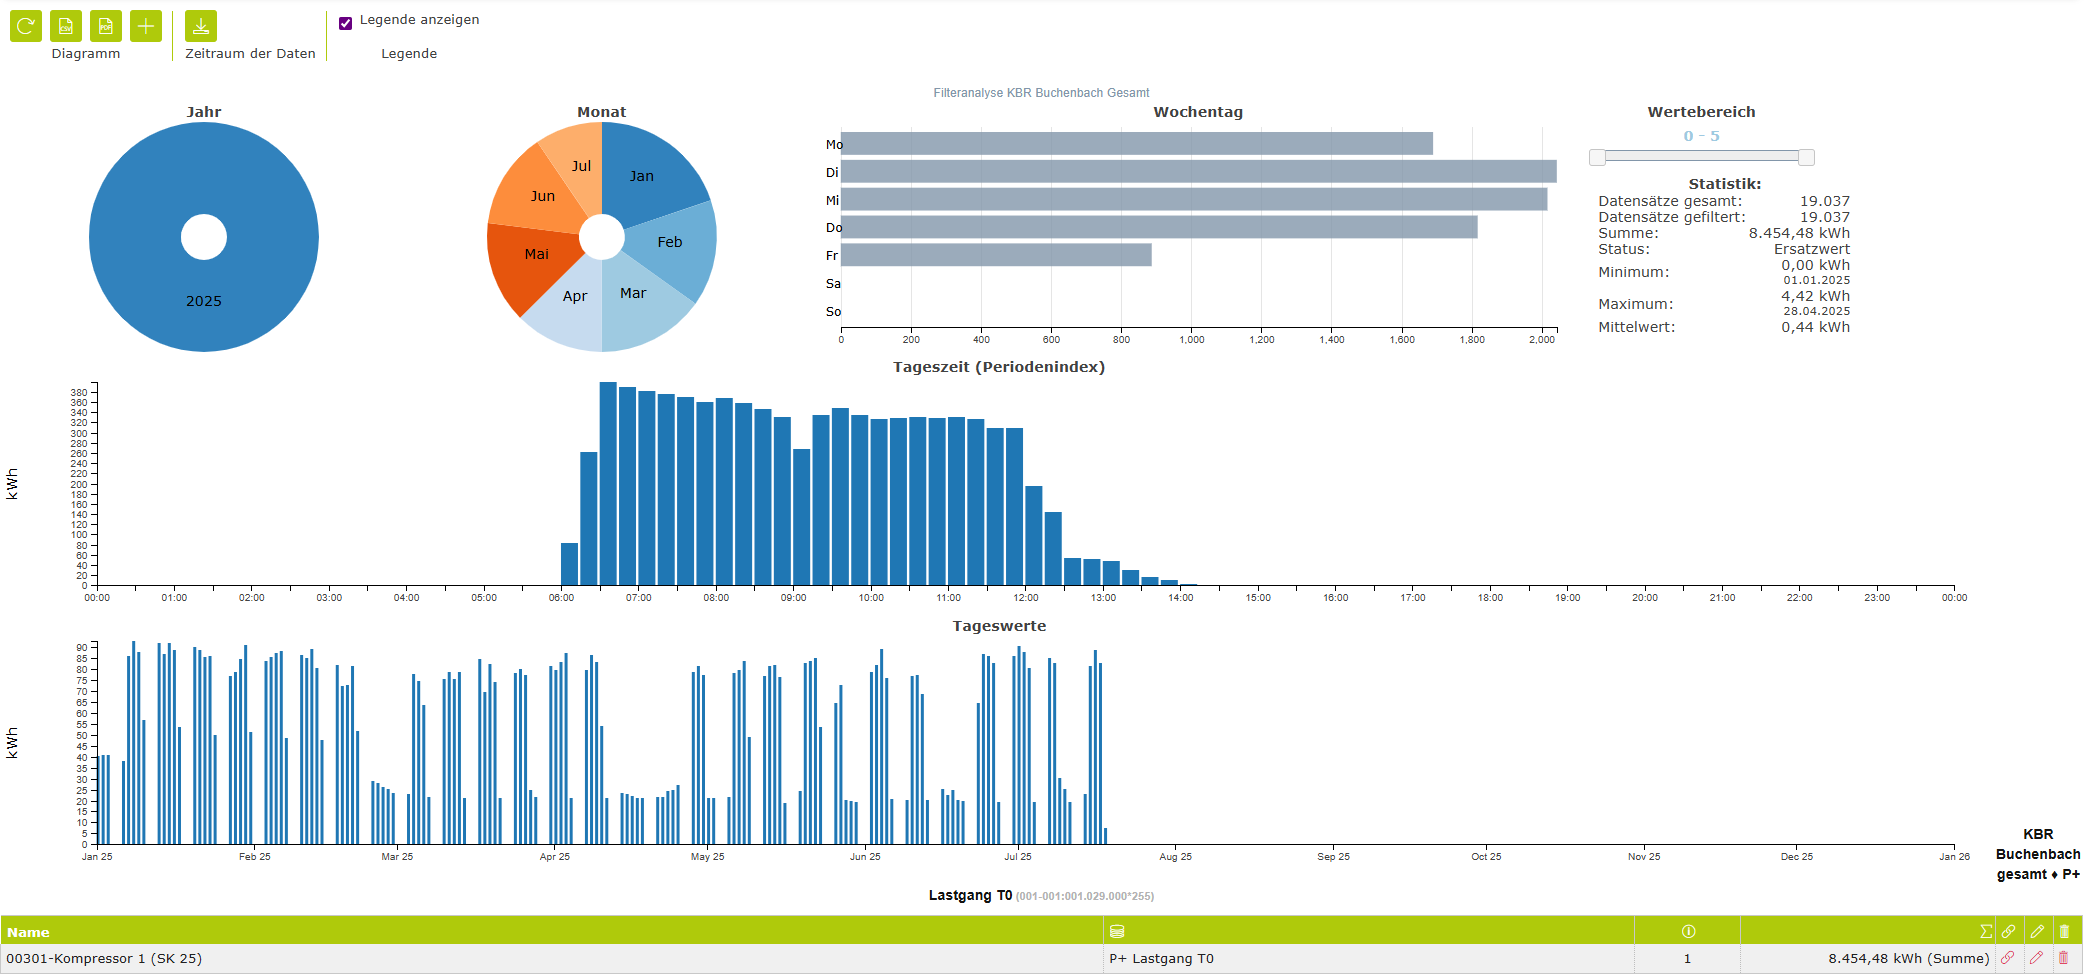
A filter analysis is a specialised chart which, as the name suggests, is more suitable for analysis than presentation. A measured variable of a metering point can be analysed in terms of its behaviour over time.
Strictly speaking, the analysis consists of five charts, which also function as interactive controls. Users can select specific time ranges and analyse the resulting consumption and average load profile. In the pie charts for year and month, as well as in the bar chart for days of the week, you can select one or more elements using the mouse. This results in a specific query pattern, for example, all days of the week in the months of June to August.