Indicators
| Indicators |

Indicators make it possible to relate consumption figures to fixed or variable influencing variables. The ratio to the influencing variable can be calculated using a freely definable formula.
An indicator is similar to a calculated metering point. It likewise has one or more measured variables. However, as each indicator ultimately defines its own measured variable, its creation is greatly simplified, with fewer dependencies and restrictions.
Indicators can be organised into folders for a clearer overview. Each folder can define its own permissions for reading or editing.
Create indicator
If necessary, select a folder in the Indicators section. Use the  button to create an indicator or a folder for indicators.
Properties
Name/Designation/Title | A meaningful text entry. The designation is used for identification and search purposes and can be changed at any time. |
Name of the measured variable | Text – Name of the resulting measured variable for the indicator. For example, “electricity consumption per unit”. |
Interval | Time-range specification. Permissible values for…
|
Code | Code for the resulting measured variable. Unlike user-defined OBIS measured variables, the code is automatically assigned by the system and refers to medium 20 – indicator |
Unit | Any text to display the unit, e.g. kWh or °C. There is no automatic aggregation from (k)ilo->(M)ega->(G)iga. Indicators are traditionally expressed as a unit / influencing variable. |
Function | Selection – Specify the aggregation function. Used when individual values in displays (tables, charts) are aggregated over longer time ranges. Examples:
|
Selection – Once folders have been created, they can be selected here. The current object will then be saved in the specified folder. If no folder is specified, the root element is used. | |
Calculation formula | Mathematical formula for the resulting data. The Formula Editor is available for creating the formula. |
Calculate an indicator
The data are calculated using the workflow “Calculate Indicator”. Where possible, this should be assigned to the indicator with a suitable schedule.
Quick view of the data
In the “OBIS measured variables” section, you can select a measured variable and view the quick data view to the right of it.
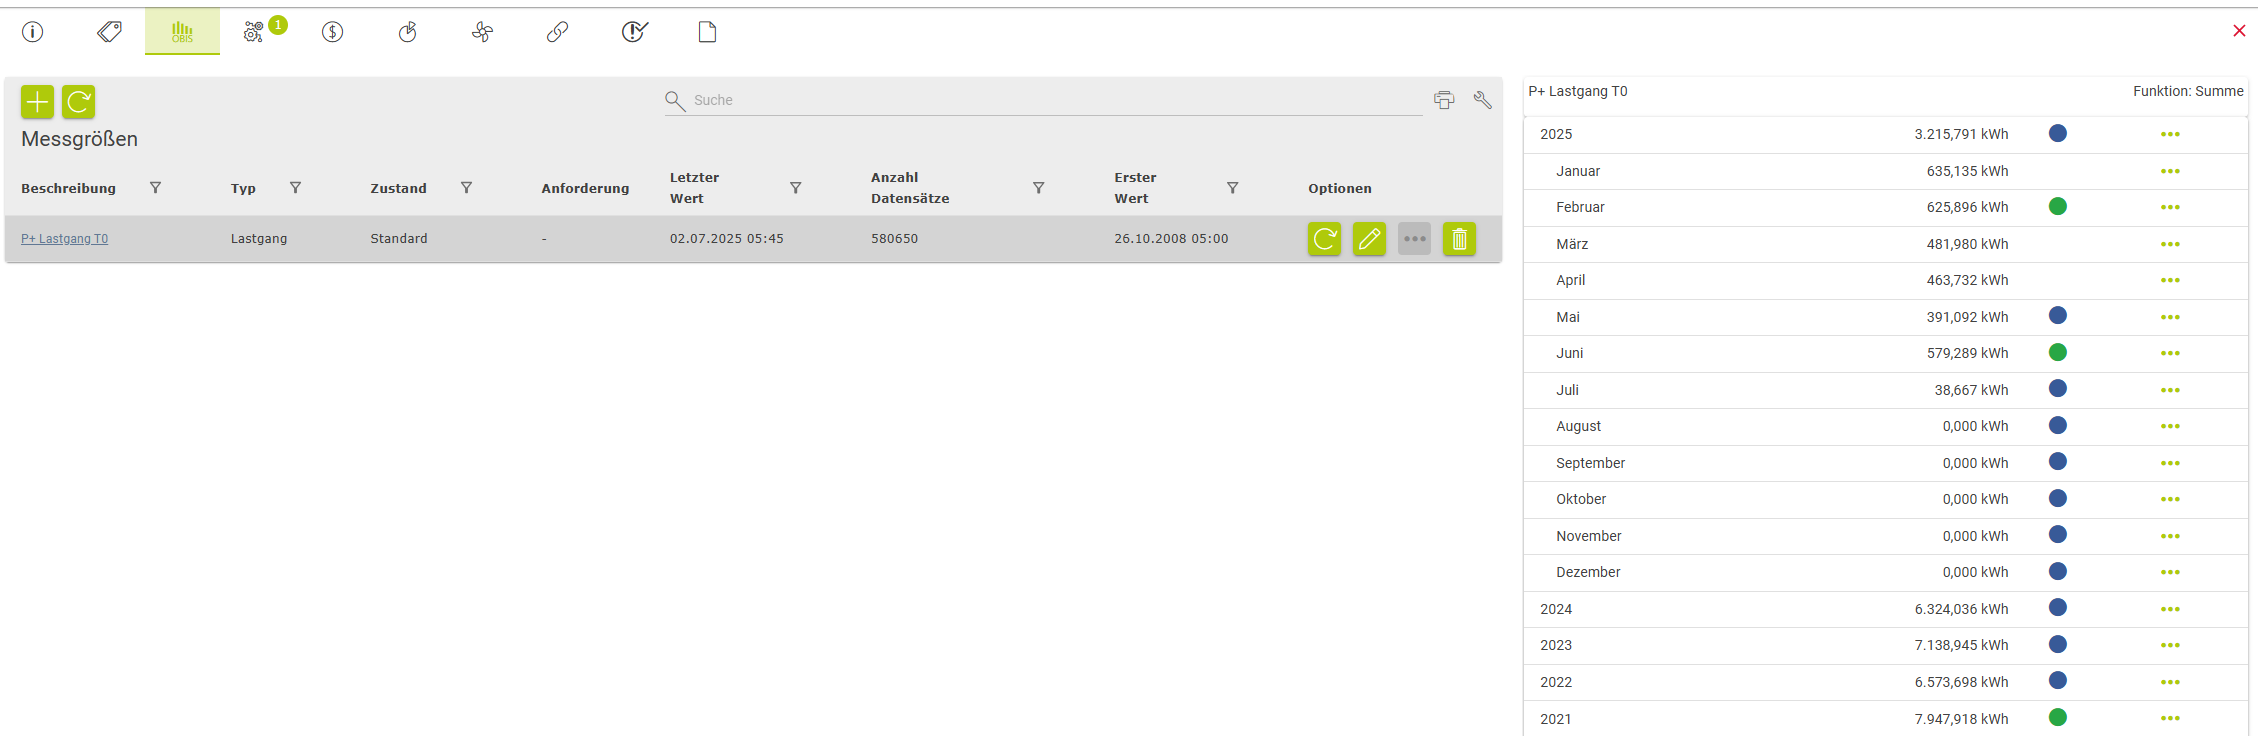
The years are shown in a table here. Clicking a row opens or closes the aggregated time range. This can also display the months and days alongside the year.
NOTICE

Both actual values from the database and virtually calculated values are displayed here.
If, for example, daily values are stored in the database, the values for the month or year are calculated using the relevant specified function (sum, average, etc.).
Caution: Indicators and aggregated values
The appropriate interval should be selected based on the reporting period, for example for an audit.
The values calculated in the quick view using the functions (sum, average, …) may be misleading! Only the values calculated using the “Interval” parameter, for example, should be used for an audit.
Background: the user interface itself calculates the aggregated values (sum, maximum, minimum, average) from the retrieved calculated indicator values. However, a mathematically correct calculation may not be possible at all.
Example: (monthly interval calculation, average display)
| Consumption | Production | Indicator |
|---|---|---|---|
January | 100 kWh | 20 pcs. | 5 (100 / 20) |
February | 25 kWh | 40 pcs. | 0.625 (25 / 40) |
Display |
|
| 2.81 (average) |
Actual value |
|
| 2.085 (125 / 60) |