Sankey diagram
| Sankey diagram |

This diagram can be used to analyse any number of channels as a Sankey diagram. A Sankey diagram is a graphical representation of flows of quantities, in which the quantities are represented by arrows whose thickness is proportional to the quantities.
Individual channels can act as inflow, connecting or outflow channels. Depending on the channel properties, sums or differences can also be calculated automatically.
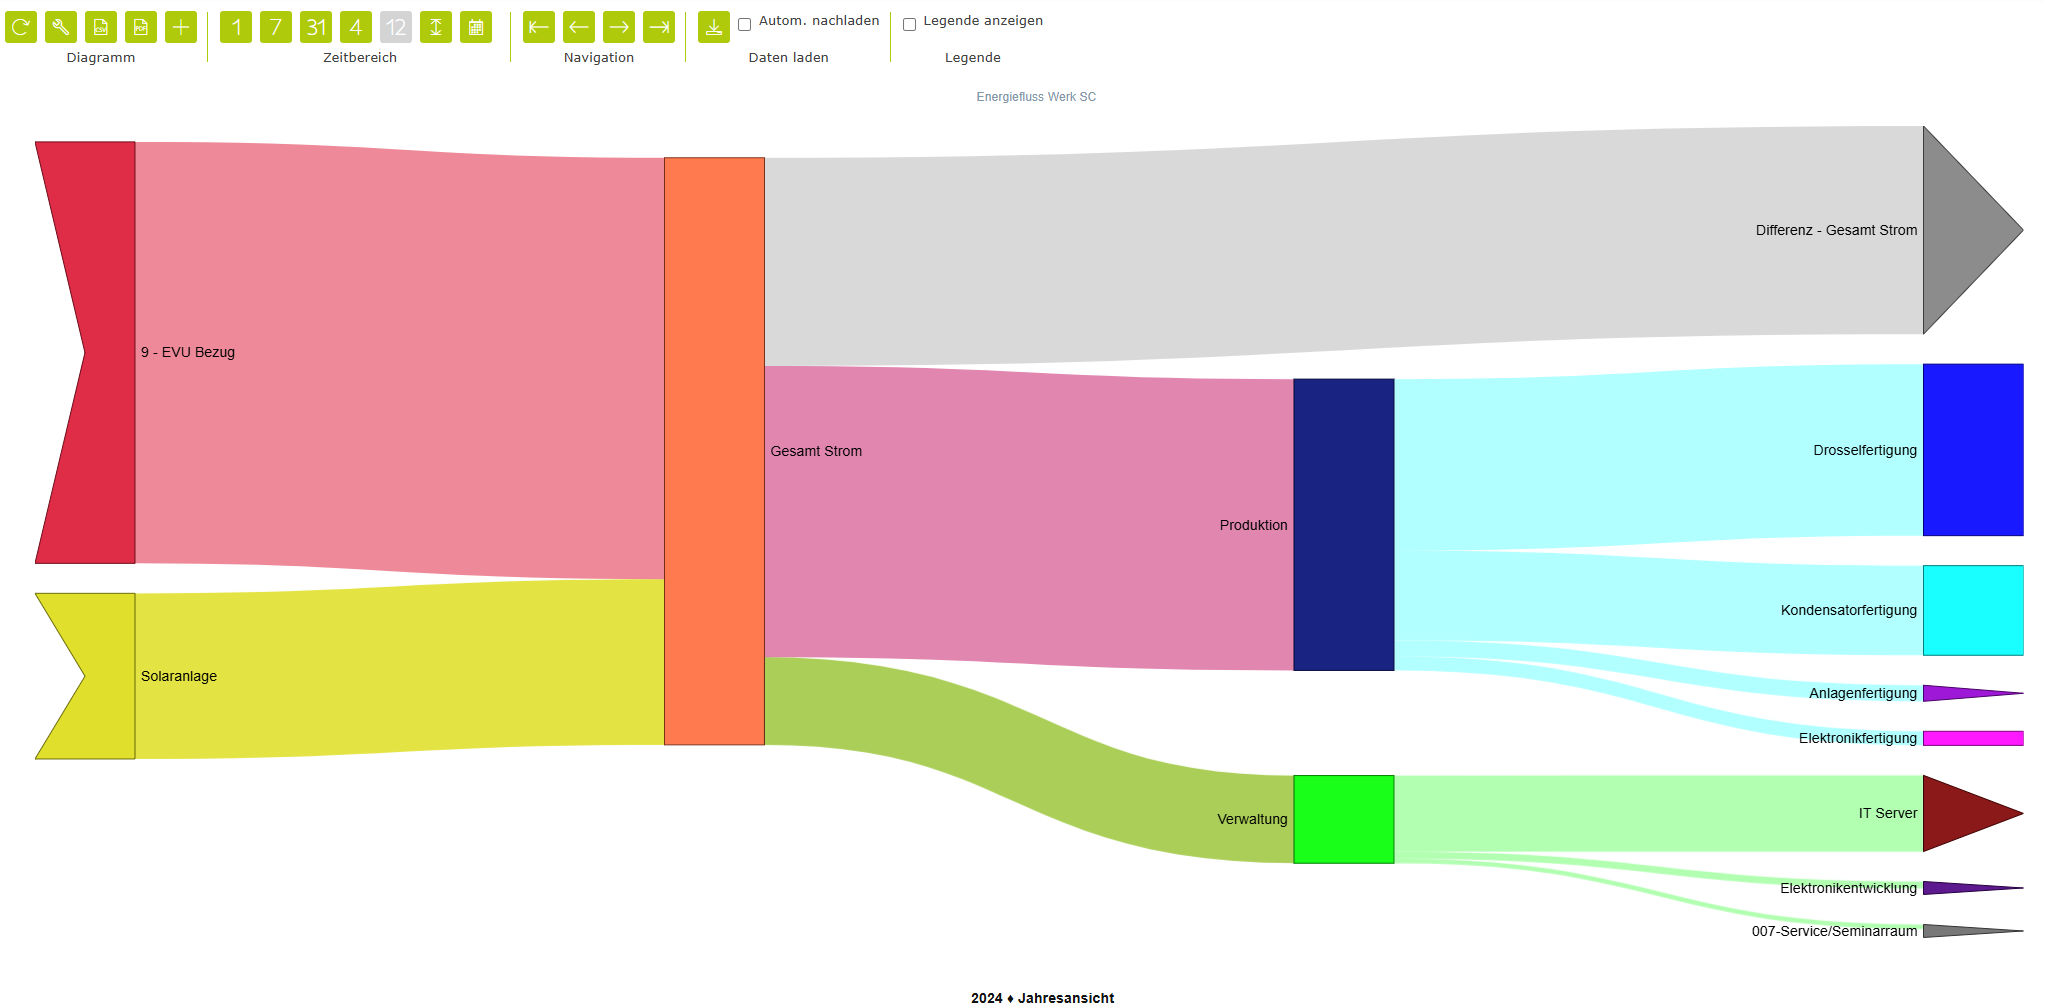
Chart properties
End shape | Selection – Possible values: Arrow, or Rectangle Graphical representation of the ends. |
Show empty channels | Yes / No – Channels with zero values can be hidden in the chart. This can make it easier to keep track of things when there are lots of channels. |
Calculate differences | Yes / No
|
Minimum channel height | Number 0–20 – For charts containing many small values, clarity and readability can be improved by increasing this value. |
Width of the channels | Number 5–100 – Used to vary the visual width of the nodes. |
Orientation of the nodes | Selection – Left – Start nodes begin at the very left-hand side of the diagram. The position of the end nodes is determined by the number of intermediate nodes. Right – End nodes are all arranged on the right-hand side of the diagram. The position of the start nodes is determined by the number of intermediate nodes. Justified – Same as “Left”, except that end nodes are always shifted to the far right. Centre – The largest number of consecutive nodes determines the left and right sides respectively. |
Highlight colour | Selection – Sets the colour displayed on mouse hover. Solid colour – Manually specify your own colour value. Channel colour – The colour value is derived from the respective channel colour. |
Sort channels manually | Yes / No – No – The order of the channels is determined by the system. Yes – Channels can be arranged interactively in the chart using the mouse. This order is retained when the data is reloaded. |
Legend | Specifies which columns are displayed in the chart legend. |
Toolbar
Chart | ||
| Refresh | Reloads the data from the database and updates the chart. Please note: any unsaved changes will be overwritten by the most recent version stored in the database. |
| CSV download | Generates a CSV data file and enables the browser’s download/save function. |
| Properties | Opens a dialog box containing the chart properties. Here, you can, among other things, show or hide the columns in the legend. |
Display (not available for all chart types) | ||
| Time chart view | Values for the current time range are displayed in a level (x)–time (y) view. Depending on the measured variable, the level can be displayed as a line, a bar or point. |
| Value table view | The values for the current time range are displayed as a table. |
| Frequency distribution view | Values in the current time range are sorted by value rather than chronologically by time. |
Time range | ||
| Day view | The time range is scaled to one day. |
| Week view | The time range is scaled to one week. |
| Month view | The time range is scaled to one month. |
| Quarter view | The time range is scaled to a quarter. |
| Year view | The time range is scaled to one year. |
| Display entire time range | The entire time range available in the database is loaded and the view is scaled accordingly. |
| Custom time range | The display range can be customised by specifying a start and end date. |
Navigation | ||
| Go to the first record | The first available data is loaded and displayed within the currently selected time range. |
| Go to the previous range | Displays the previous range. |
| Go to the next range | Displays the next time range. |
| Go to the last record | The most recent available data are loaded and displayed within the currently selected time range. |
Show legend | ||
Allows you to show or hide the legend. | ||


Channel properties
Name/Designation/Title | A meaningful text entry. The designation is used for identification and search purposes and can be changed at any time. |
Enabled | Yes / No – Enables or disables the object. |
Colour | Selection – Allows you to customise the colour for the channel. |
Rank | Number – Allows you to set the order of the channels. The order can be crucial when elements overlap. This property can also be changed by dragging the channel with the mouse. The first channel is ranked 0, and so on. |
Labels | The labels can be customised for each channel (circular, pie or doughnut segment):
|
Connections | Definition of the inflow and outflow connections:
|