Metering point
| Metering point |
A metering point uniquely defines either a point in the supply network or the combination of several measurement points (virtual metering point). A metering point in visual energy therefore largely corresponds to the term “metering location” used in the German Metering Point Operation Act.
With the exception of project metering points, each metering point is assigned to exactly one medium at a location and to one network operator. If the user creates a distribution structure in visual energy, (system) metering points for distribution totals and differences are automatically generated.
Show / list metering points
- In the “Data Collection” workspace, select a location and then the relevant location medium.
- Use the
 button to select the metering point view.
Add metering points
You can add a metering point using the + button.
- Select the appropriate type
- Assign a network operator.
- The “Meter number” field is optional and can be used, for example, for the company’s internal equipment number.
- Specifying the installation location is also optional and helps with searching for or identifying it on site.
Properties
Name/Designation/Title | A meaningful text entry. The designation is used for identification and search purposes and can be changed at any time. |
|
|
Metering point ID | Unique ID of the metering point. The metering point ID is generated according to a defined rule and therefore cannot be freely specified by the user. The generation rule can be defined on a country-specific basis. |
| |
Generated from |
|
Country | Country code, e.g. DE for Germany or CH for Switzerland |
Network operator number | Unique ID of the network operator. The number is taken from the “Network operator” property, but can be changed when the metering point is created. Default: 6 characters |
Postcode | Default: 5 characters |
Code | Default: 20 characters |

 The current object is selected as a favourite.
Quick view of the data
In the “OBIS measured variables” section, you can select a measured variable and view the quick data view to the right of it.
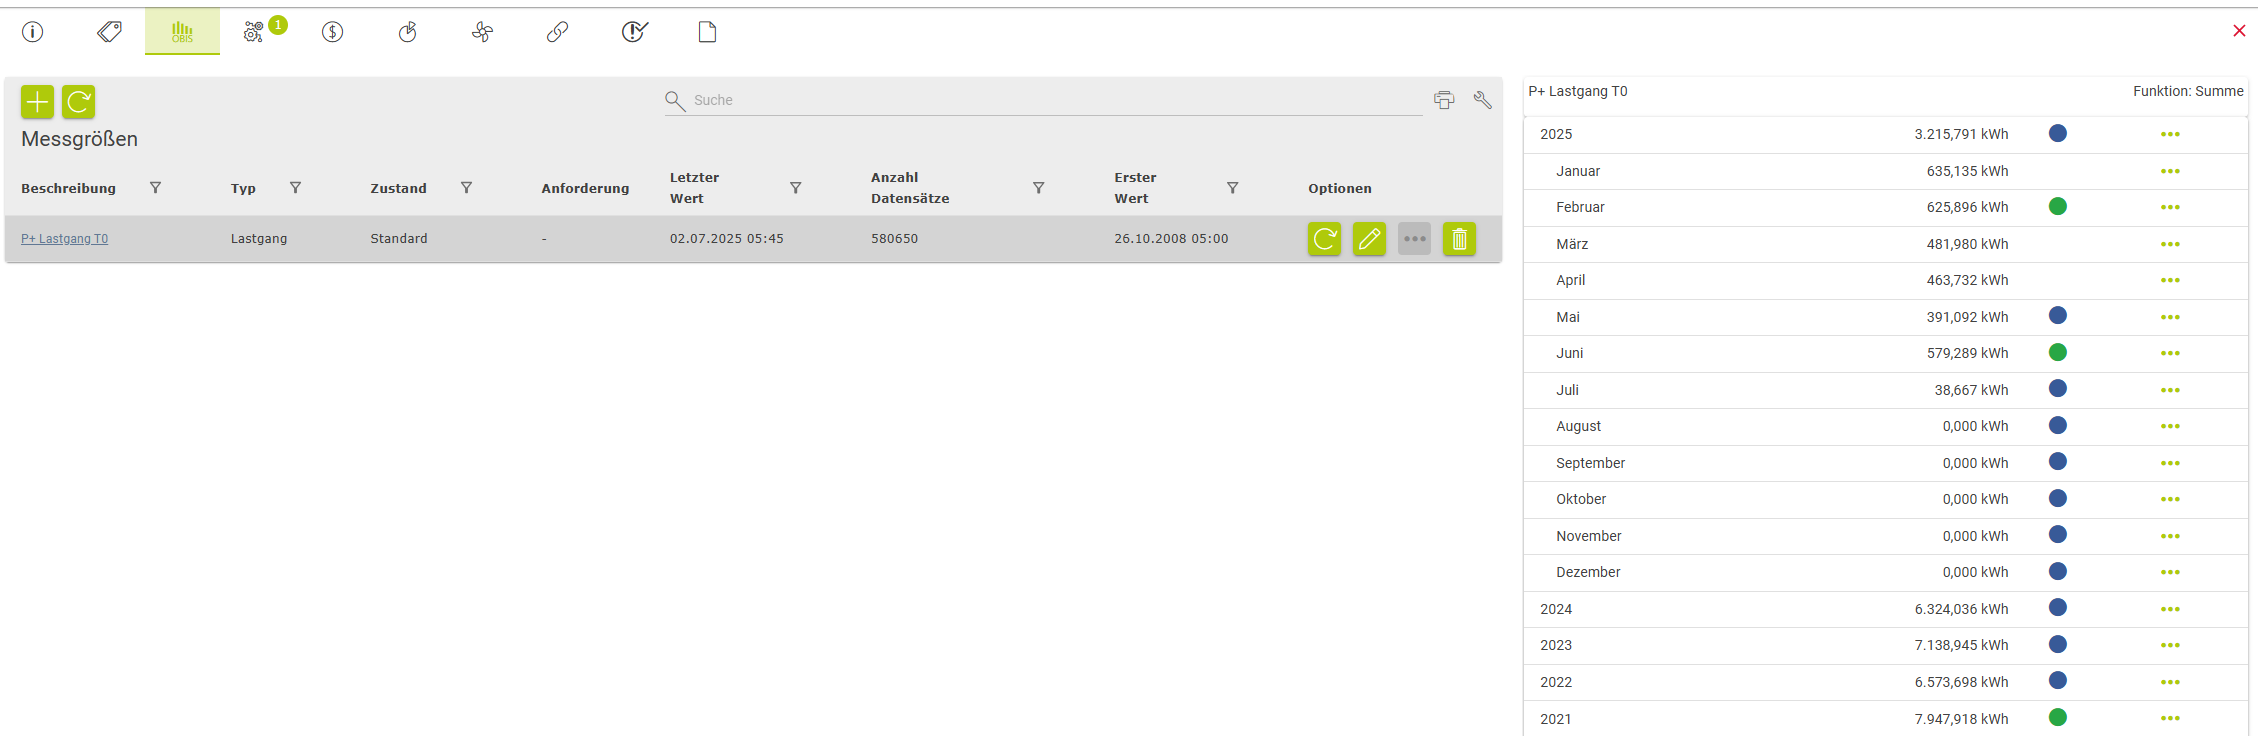
The years are shown in a table here. Clicking a row opens or closes the aggregated time range. This can also display the months and days alongside the year.
NOTICE

Both actual values from the database and virtually calculated values are displayed here.
If, for example, daily values are stored in the database, the values for the month or year are calculated using the relevant specified function (sum, average, etc.).
Caution: Indicators and aggregated values
The appropriate interval should be selected based on the reporting period, for example for an audit.
The values calculated in the quick view using the functions (sum, average, …) may be misleading! Only the values calculated using the “Interval” parameter, for example, should be used for an audit.
Background: the user interface itself calculates the aggregated values (sum, maximum, minimum, average) from the retrieved calculated indicator values. However, a mathematically correct calculation may not be possible at all.
Example: (monthly interval calculation, average display)
| Consumption | Production | Indicator |
|---|---|---|---|
January | 100 kWh | 20 pcs. | 5 (100 / 20) |
February | 25 kWh | 40 pcs. | 0.625 (25 / 40) |
Display |
|
| 2.81 (average) |
Actual value |
|
| 2.085 (125 / 60) |